Advertisements
In this post, we will rank the Top 50 US States by GDP per capita. Here you will see the full list of US States by Economy. You might want to know which state in USA has the best economy.
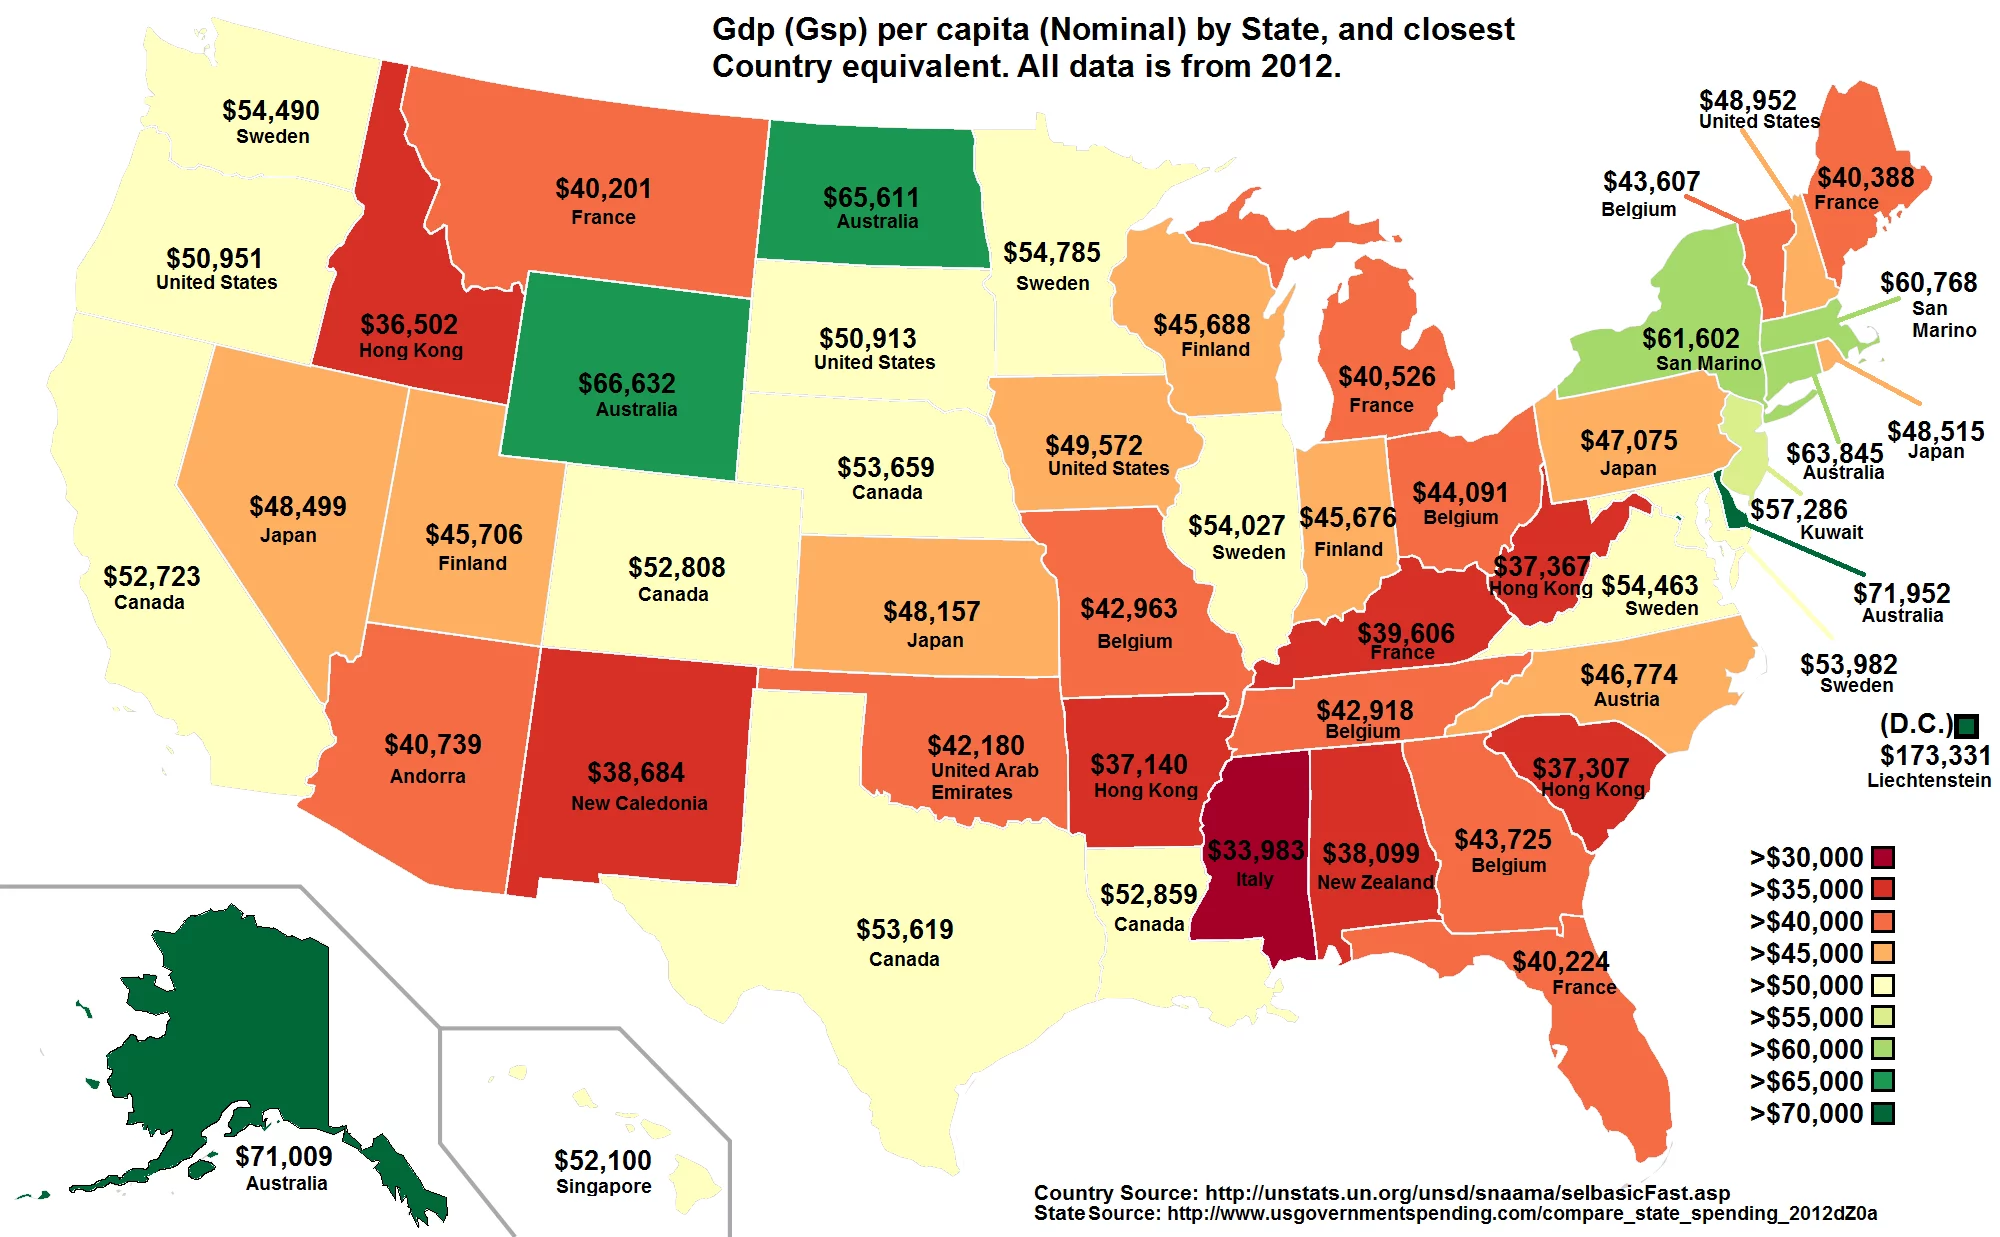
Top 50 US States by GDP per capita
| List of U.S. states and territories by GDP in 2010 | ||||||
| GDP Rank |
State | GDP (Millions) |
Percentage of national GDP |
Population (Millions) |
GDP per capita ($) |
GDP |
| United States | 14,657,800 | 100.00 | 308.7 | 47,482 | ||
| 1 | California | 1,936,400 | 13.34 | 37.3 | 51,914 | 12 |
| 2 | Texas | 1,307,432 | 7.95 | 25.1 | 45,940 | 24 |
| 3 | New York | 1,156,500 | 7.68 | 19.4 | 57,423 | 7 |
| 4 | Florida | 754,000 | 5.20 | 18.8 | 40,106 | 40 |
| 5 | Illinois | 644,200 | 4.44 | 12.8 | 50,328 | 15 |
| 6 | Pennsylvania | 575,600 | 3.97 | 12.7 | 45,323 | 25 |
| 7 | New Jersey | 497,000 | 3.42 | 8.8 | 56,477 | 8 |
| 8 | Ohio | 483,400 | 3.33 | 11.5 | 42,035 | 33 |
| 9 | Virginia | 427,700 | 2.95 | 8.0 | 53,463 | 9 |
| 10 | North Carolina | 407,400 | 2.81 | 9.5 | 42,884 | 31 |
| 11 | Georgia | 403,100 | 2.79 | 9.7 | 41,711 | 35 |
| 12 | Massachusetts | 377,700 | 2.60 | 6.5 | 58,108 | 6 |
| 13 | Michigan | 372,400 | 2.57 | 9.9 | 37,616 | 42 |
| 14 | Washington | 351,100 | 2.42 | 6.7 | 52,403 | 10 |
| 15 | Maryland | 300,000 | 2.07 | 5.8 | 51,724 | 13 |
| 16 | Indiana | 267,600 | 1.84 | 6.5 | 41,169 | 36 |
| 17 | Minnesota | 267,100 | 1.84 | 5.3 | 50,396 | 14 |
| 18 | Arizona | 261,300 | 1.80 | 6.4 | 40,828 | 39 |
| 19 | Colorado | 259,700 | 1.79 | 5.0 | 51,940 | 11 |
| 20 | Wisconsin | 251,400 | 1.73 | 5.7 | 44,105 | 29 |
| 21 | Tennessee | 250,300 | 1.72 | 6.3 | 39,730 | 41 |
| 22 | Missouri | 246,700 | 1.70 | 6.0 | 41,117 | 37 |
| 23 | Connecticut | 233,400 | 1.61 | 3.6 | 64,833 | 4 |
| 24 | Louisiana | 213,600 | 1.47 | 4.5 | 47,467 | 21 |
| 25 | Alabama | 174,400 | 1.20 | 4.8 | 36,333 | 46 |
| 26 | Oregon | 168,900 | 1.16 | 3.8 | 44,447 | 27 |
| 27 | South Carolina | 164,300 | 1.13 | 4.6 | 35,717 | 48 |
| 28 | Kentucky | 161,400 | 1.11 | 4.3 | 37,535 | 43 |
| 29 | Oklahoma | 160,500 | 1.11 | 3.8 | 42,237 | 32 |
| 30 | Iowa | 147,200 | 1.01 | 3.0 | 49,067 | 19 |
| 31 | Kansas | 128,500 | 0.89 | 2.9 | 44,310 | 28 |
| 32 | Nevada | 127,500 | 0.88 | 2.7 | 47,222 | 23 |
| 33 | Utah | 116,900 | 0.81 | 2.8 | 41,750 | 34 |
| 34 | Arkansas | 105,800 | 0.73 | 2.9 | 36,483 | 45 |
| 35 | District of Columbia | 104,700 | 0.72 | 0.6 | 174,500 | 1 |
| 36 | Mississippi | 98,900 | 0.68 | 3.0 | 32,967 | 51 |
| 37 | Nebraska | 89,600 | 0.62 | 1.8 | 49,778 | 17 |
| 38 | New Mexico | 75,500 | 0.52 | 2.1 | 35,952 | 47 |
| 39 | Hawaii | 68,900 | 0.47 | 1.4 | 49,214 | 18 |
| 40 | West Virginia | 66,600 | 0.46 | 1.9 | 35,053 | 49 |
| 41 | Delaware | 62,700 | 0.43 | 0.9 | 69,667 | 2 |
| 42 | New Hampshire | 61,600 | 0.42 | 1.3 | 47,385 | 22 |
| 43 | Idaho | 54,800 | 0.38 | 1.6 | 34,250 | 50 |
| 44 | Maine | 53,200 | 0.37 | 1.3 | 40,923 | 38 |
| 45 | Rhode Island | 49,500 | 0.34 | 1.1 | 45,000 | 26 |
| 46 | Alaska | 45,600 | 0.31 | 0.7 | 65,143 | 3 |
| 47 | South Dakota | 39,900 | 0.27 | 0.8 | 49,875 | 16 |
| 48 | Wyoming | 38,200 | 0.26 | 0.6 | 63,667 | 5 |
| 49 | Montana | 37,200 | 0.26 | 1.0 | 37,200 | 44 |
| 50 | North Dakota | 33,400 | 0.23 | 0.7 | 47,714 | 20 |
| 51 | Vermont | 26,400 | 0.18 | 0.6 | 44,000 | 30 |
Source: The United States Bureau of Economic Analysis is responsible for finding this number each year.
Advertisements
See Also: List of US States by Area Size, Square Miles, Water Area
Please Share!